Creating an API-based Chart
Sometimes, charts data are complicated and closely tied to your business. Forest allows you to code how the chart is computed. Choose API as the data source when configuring your chart..png?fit=max&auto=format&n=XG_FfWf8cKiyLgEH&q=85&s=ff38cb3bedabcae2001847a9ed6c125c)
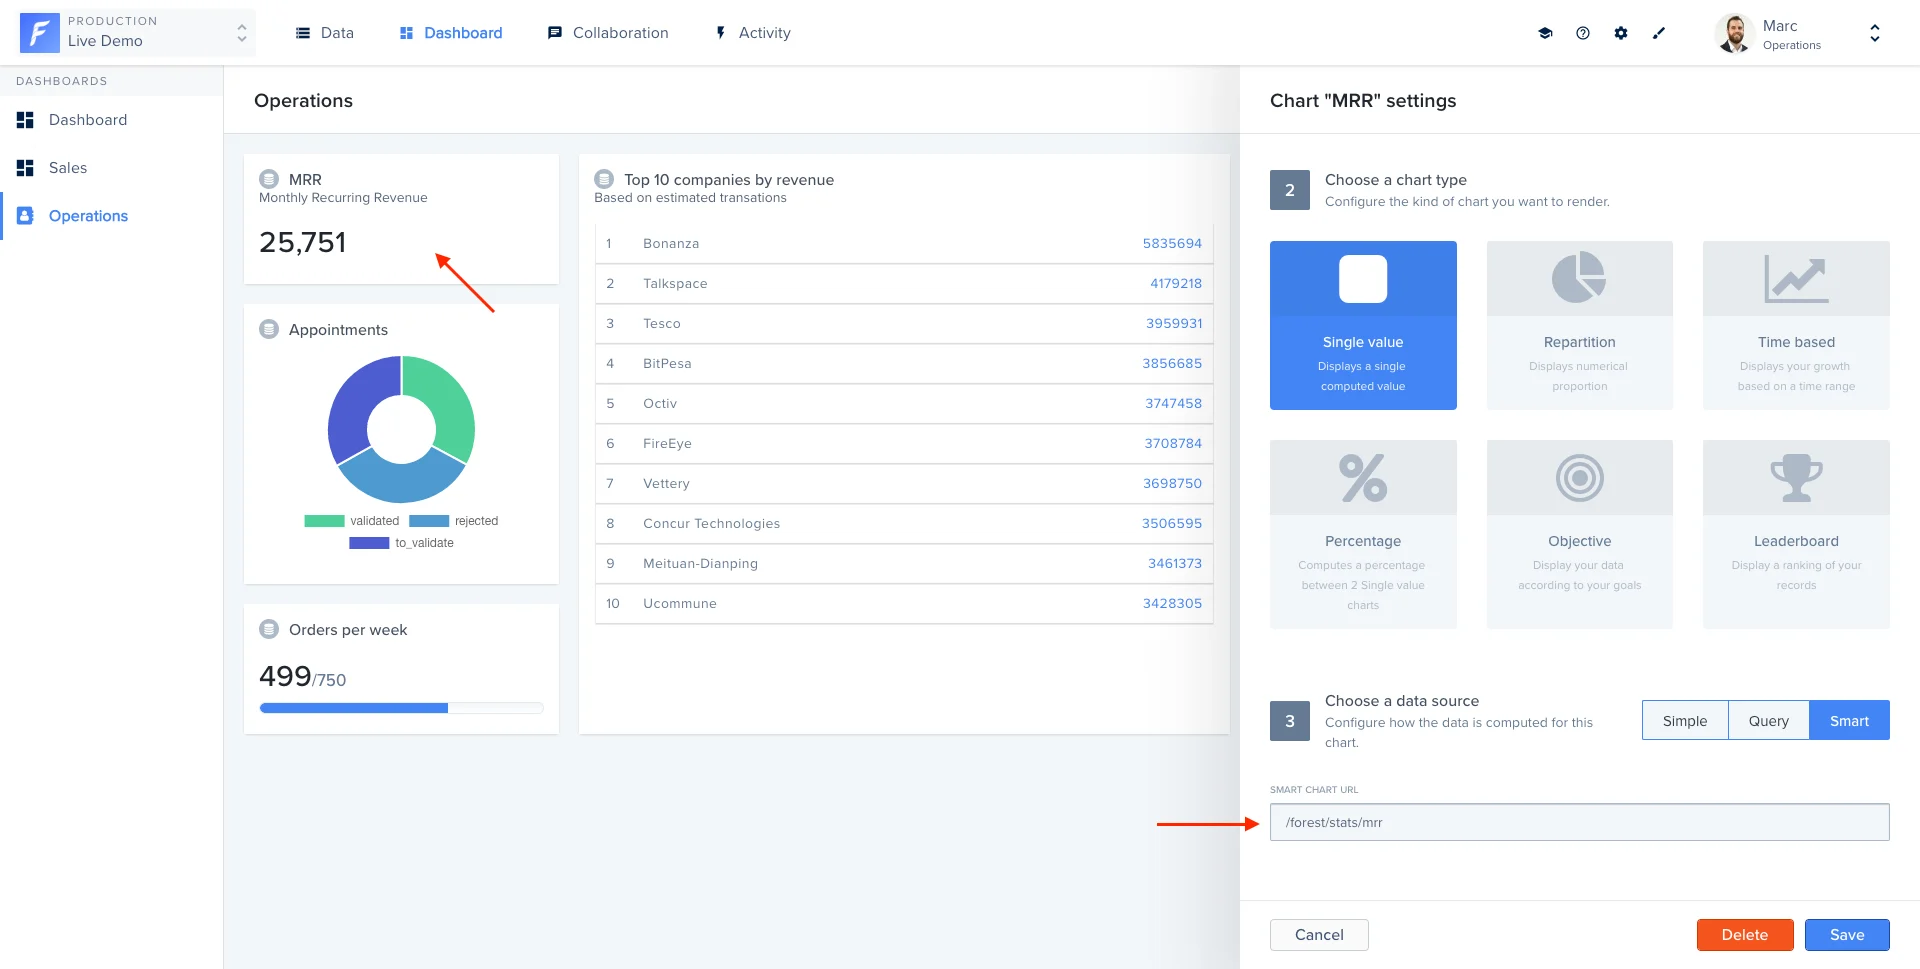
Value API-based Chart
On our Live Demo, we have aMRR value chart which computes our Monthly Recurring Revenue. This chart queries the Stripe API to get all charges made in the current month (in March for this example).
When serializing the data, we use the serialize_model() method. Check the value syntax below.
Repartition API-based Chart
On our Live Demo, we have aCharges repartition chart which shows a repartition chart distributed by credit card country. This chart queries the Stripe API to get all charges made in the current month (in March for this example) and check the credit card country.
- Rails
- Laravel
When serializing the data, we use the
serialize_model() method. Check the value syntax below.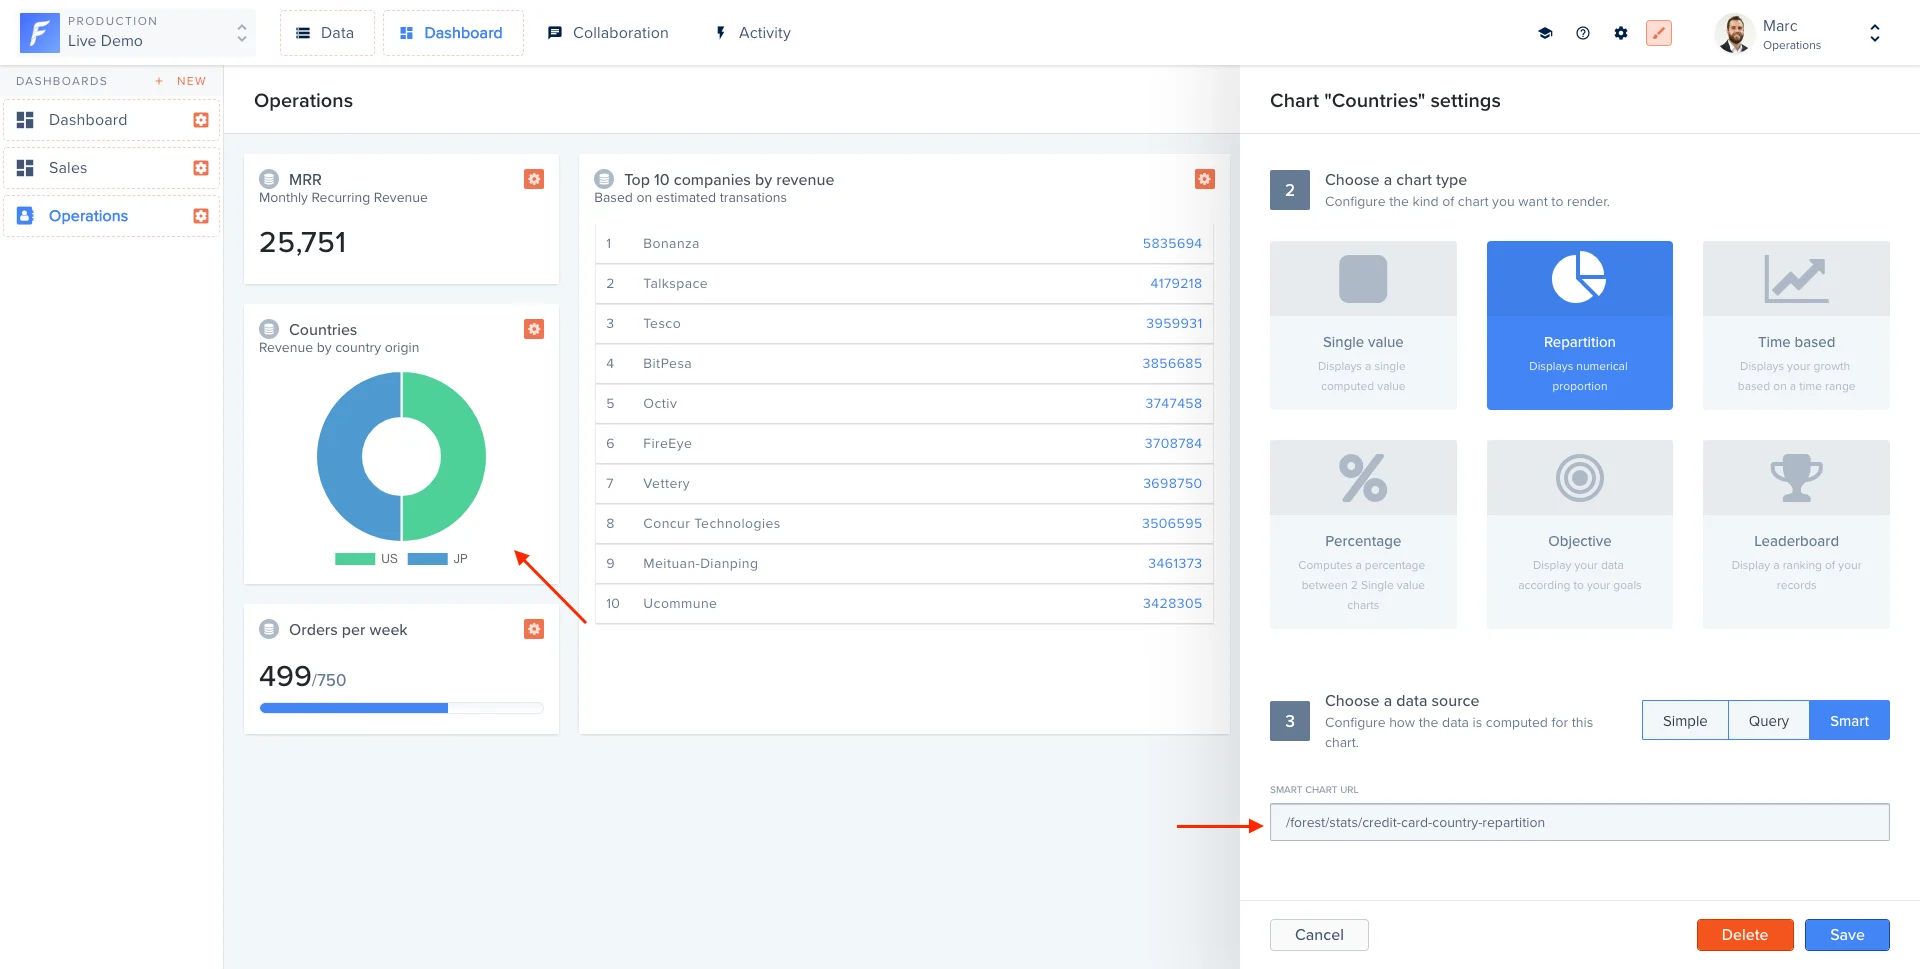
Time-based API-based Chart
On our Live Demo, we have aCharges time-based chart which shows the number of charges per day. This chart queries the Stripe API to get all charges made in the current month (in March for this example) and group data by day.
- Rails
- Laravel
When serializing the data, we use the
serialize_model() method. Check the value syntax below.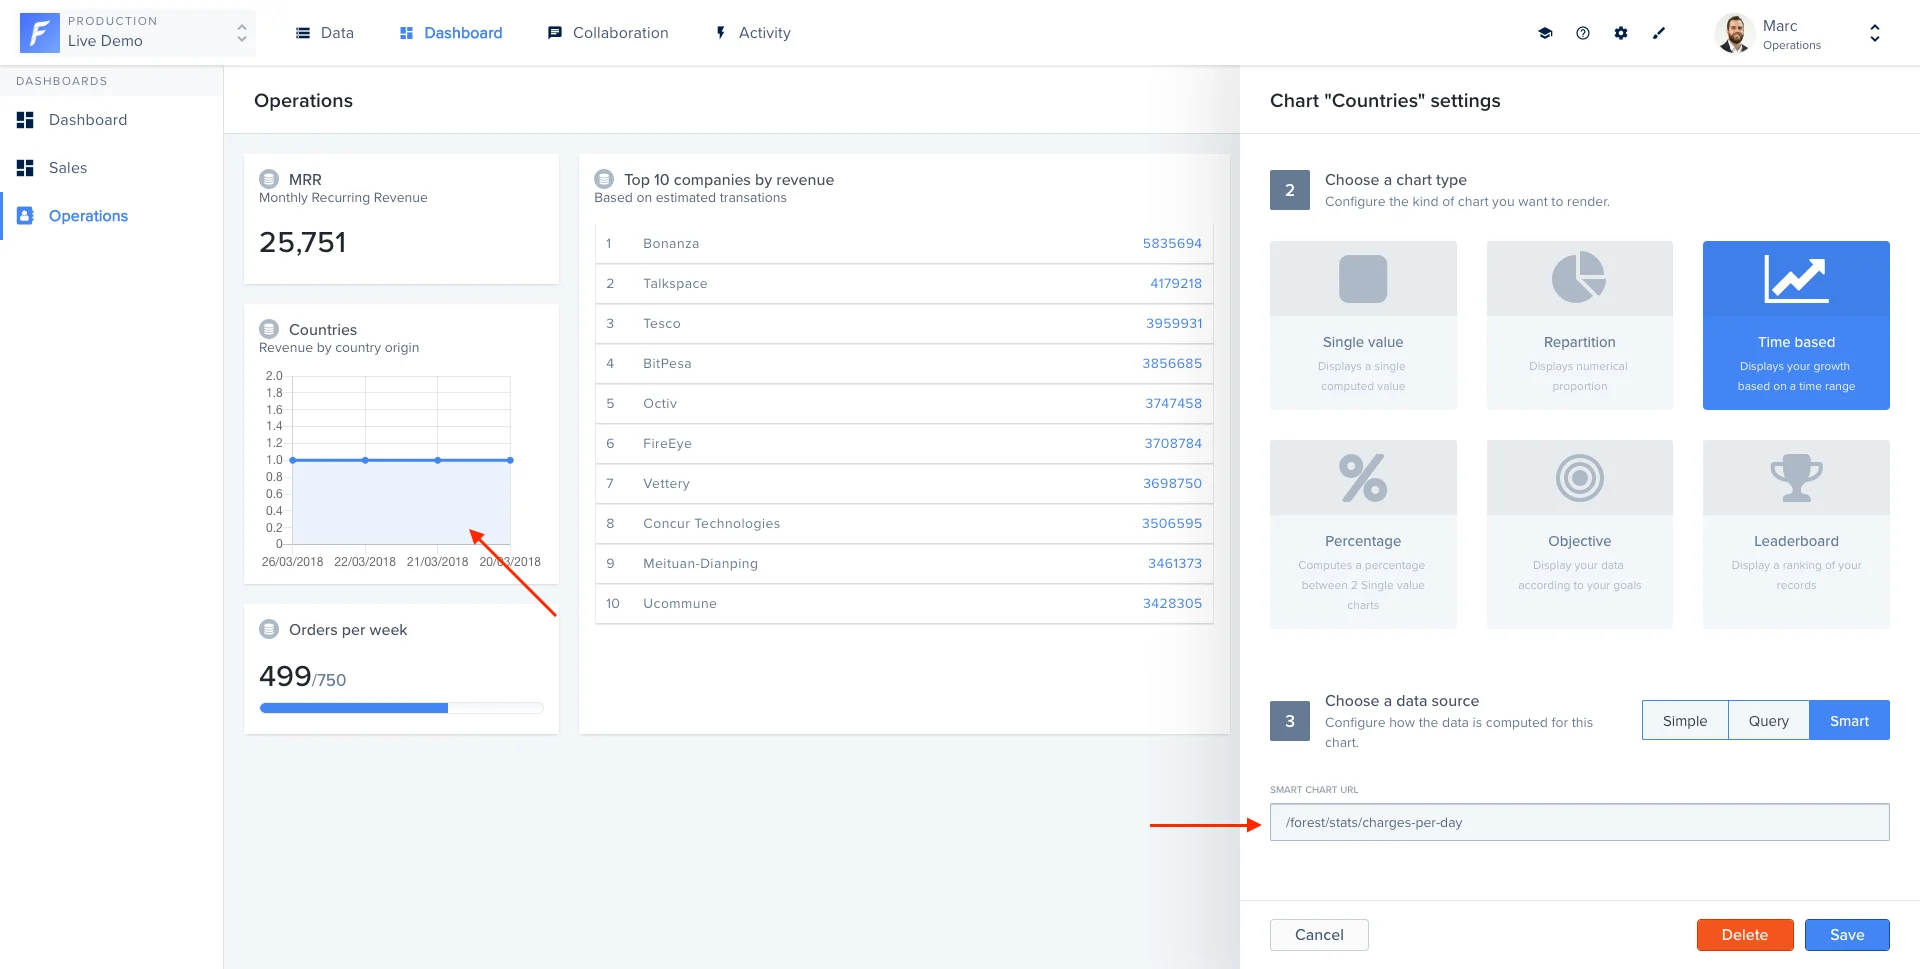
Objective API-based Chart
Creating an Objective Smart Chart means you’ll be fetching your data from an external API endpoint:.png?fit=max&auto=format&n=XG_FfWf8cKiyLgEH&q=85&s=4976abd8f196c5e63db1149cc95494dc)
- Rails
- Laravel